Tampa Bay Area Household Travel Survey 1996
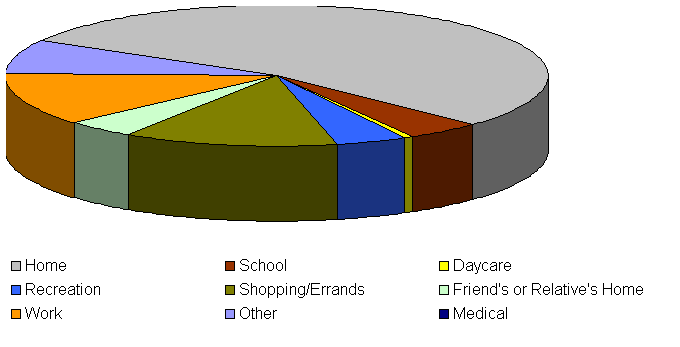
Home-based Trip Distribution by Purpose at Origin
Trip Distribution by Purpose at Origin with Trip Destination "Home"
Home-based Trip Distribution by Purpose at Origin
|
Trip Purpose at Origin |
Trip Frequency |
Percent Trip Frequency |
|
Home |
12741 |
53.9 |
|
School |
1030 |
4.4 |
|
Daycare |
188 |
0.8 |
|
Recreation |
973 |
4.1 |
|
Shopping/Errands |
3029 |
12.8 |
|
Friend's or Relative's Home |
951 |
4.0 |
|
Work |
2886 |
12.2 |
|
Other |
1846 |
7.8 |
|
Medical |
13 |
0.1 |
|
Home |
23657 |
100.0 |

Trip Distribution by Purpose at Origin with Trip Destination "Home"
|
Trip Purpose at Origin |
Trip Frequency |
Percent Trip Frequency |
|
School |
1030 |
9.4 |
|
Daycare |
188 |
1.7 |
|
Recreation |
973 |
8.9 |
|
Shop/errand |
3029 |
27.7 |
|
Friend's or Relative's Home |
951 |
8.7 |
|
Work |
2886 |
26.4 |
|
Other |
1846 |
16.9 |
|
Medical |
13 |
0.1 |
|
Home |
10916 |
100.0 |