Southeast Florida Household Travel Survey 1999
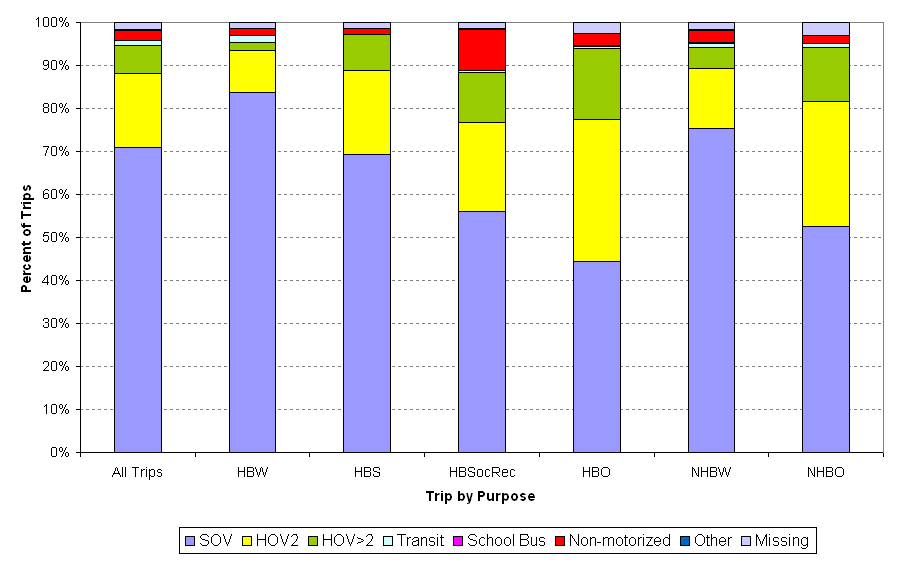
Modal Split of Commuters by Trip Purpose
HBW: Home-based work trips
HBS: Home-based shopping trips
HBSocRec: Home-based social/recreational trips
HBO: Home-based other trips
NHBW: Non home-based work trips
NHBO: Non home-based other trips
SOV: Single-occupant vehicle
HOV2: High occupancy vehicle with occupancy 2
HOV>2: High occupancy vehicle with occupancy > 2
Transit: City/Public Bus
Non-motorized: Walk + Bicycle
|
Trip Purpose |
SOV |
HOV2 |
HOV>2 |
Transit |
School Bus |
Non-motorized |
Other |
Missing |
Total |
|
All Trips |
70.97% |
17.07% |
6.64% |
1.08% |
0.06% |
2.33% |
0.13% |
1.73% |
100.00% |
|
HBW |
83.76% |
9.69% |
2.00% |
1.54% |
0.02% |
1.60% |
0.11% |
1.29% |
100.00% |
|
HBS |
69.31% |
19.49% |
8.40% |
0.12% |
0.00% |
1.22% |
0.12% |
1.34% |
100.00% |
|
HBSocRec |
56.03% |
20.69% |
11.55% |
0.52% |
0.00% |
9.48% |
0.34% |
1.38% |
100.00% |
|
HBO |
44.39% |
33.08% |
16.47% |
0.47% |
0.26% |
2.67% |
0.04% |
2.62% |
100.00% |
|
NHBW |
75.34% |
13.90% |
5.02% |
0.96% |
0.04% |
2.95% |
0.23% |
1.57% |
100.00% |
|
NHBO |
52.56% |
29.07% |
12.55% |
0.92% |
0.08% |
1.68% |
0.08% |
3.06% |
100.00% |
