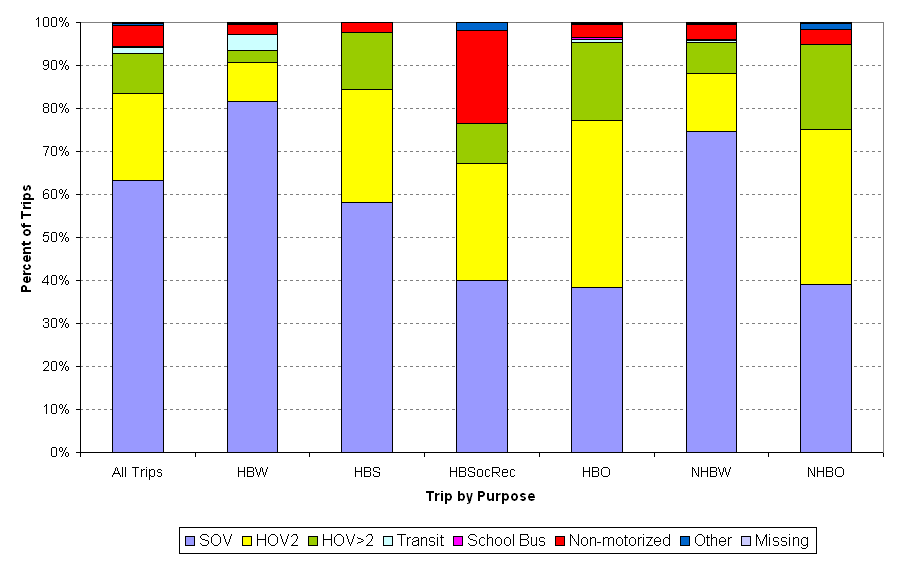
National Household Travel Survey 2001, Florida
Modal Split of Commuters by Trip Purpose
HBW: Home-based work trips
HBS: Home-based shopping trips
HBSocRec: Home-based social/recreational trips
HBO: Home-based other trips
NHBW: Non home-based work trips
NHBO: Non home-based other trips
SOV: Single-occupant vehicle
HOV2: High occupancy vehicle with occupancy 2
HOV>2: High occupancy vehicle with occupancy > 2
Transit: City/Public Bus
Non-motorized: Walk + Bicycle
|
Trip Purpose |
SOV |
HOV2 |
HOV>2 |
Transit |
School Bus |
Non-motorized |
Other |
Missing |
Total |
|
All Trips |
63.35% |
20.23% |
9.29% |
1.35% |
0.11% |
4.90% |
0.58% |
0.20% |
100.00% |
|
HBW |
81.67% |
9.03% |
2.77% |
3.71% |
0.00% |
2.24% |
0.24% |
0.35% |
100.00% |
|
HBS |
58.05% |
26.45% |
13.26% |
0.00% |
0.00% |
2.18% |
0.06% |
0.00% |
100.00% |
|
HBSocRec |
39.93% |
27.18% |
9.46% |
0.00% |
0.00% |
21.50% |
1.93% |
0.00% |
100.00% |
|
HBO |
38.38% |
38.82% |
18.26% |
0.49% |
0.61% |
2.96% |
0.35% |
0.13% |
100.00% |
|
NHBW |
74.64% |
13.54% |
7.11% |
0.49% |
0.16% |
3.49% |
0.36% |
0.21% |
100.00% |
|
NHBO |
39.10% |
35.93% |
19.93% |
0.00% |
0.00% |
3.44% |
1.35% |
0.25% |
100.00% |
