Northeast Florida Household Travel Survey 2000
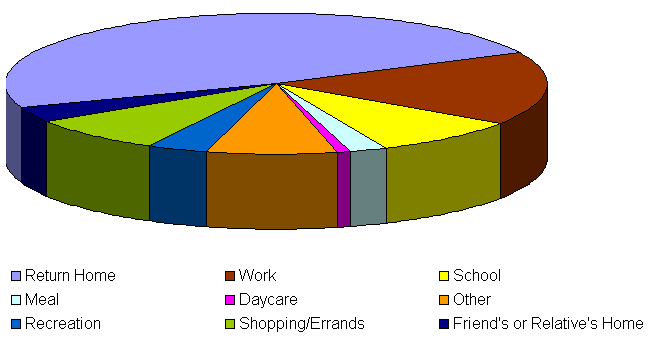
Home-based Trip Distribution by Purpose at Destination
Trip Distribution by Purpose at Destination with Trip Originating at Home
Home-based Trip Distribution by Purpose at Destination
|
Trip Purpose at Destination |
Trip Frequency |
Percent Trip Frequency |
|
Home |
9118 |
48.35 |
|
Work |
3127 |
16.58 |
|
School |
1669 |
8.85 |
|
Meal |
425 |
2.25 |
|
Daycare |
175 |
0.93 |
|
Other |
1484 |
7.87 |
|
Recreation |
664 |
3.52 |
|
Shopping/Errands |
1574 |
8.35 |
|
Friend's or Relative's Home |
623 |
3.30 |
|
Total |
18859 |
100.00 |

Trip Distribution by Purpose at Destination with Trip Originating at Home
|
Trip Purpose at Destination |
Trip Frequency |
Percent Trip Frequency |
|
Home |
451 |
4.43 |
|
Work |
2264 |
30.68 |
|
School |
1298 |
16.38 |
|
Meal |
485 |
4.17 |
|
Daycare |
164 |
1.72 |
|
Other |
1165 |
14.56 |
|
Recreation |
614 |
6.51 |
|
Shopping/Errands |
1996 |
15.44 |
|
Friend's or Relative's Home |
681 |
6.11 |
|
Total |
9118 |
100.00 |