Tampa Bay Area Household Travel Survey 1996
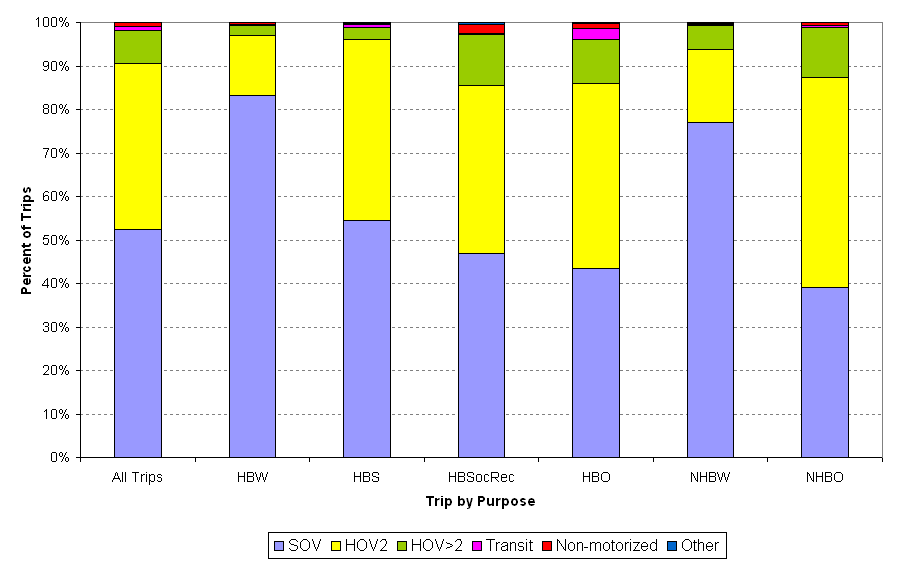
Modal Split by Trip Purpose (One Car Household)
HBW: Home-based work trips
HBS: Home-based shopping trips
HBSocRec: Home-based social/recreational trips
HBO: Home-based other trips
NHBW: Non home-based work trips
NHBO: Non home-based other trips
SOV: Single-occupant vehicle
HOV2: High occupancy vehicle with occupancy 2
HOV>2: High occupancy vehicle with occupancy > 2
Transit: City/Public Bus
Non-motorized: Walk + Bicycle
|
Trip Purpose |
SOV |
HOV2 |
HOV>2 |
Transit |
Non-motorized |
Other |
Total |
N |
|
All Trips |
52.4% |
38.1% |
7.6% |
0.9% |
0.9% |
0.1% |
100.0% |
8709 |
|
HBW |
83.2% |
13.9% |
2.3% |
0.1% |
0.5% |
0.0% |
100.0% |
933 |
|
HBS |
54.5% |
41.5% |
2.9% |
0.6% |
0.3% |
0.2% |
100.0% |
2308 |
|
HBSocRec |
46.9% |
38.7% |
11.7% |
0.2% |
2.0% |
0.5% |
100.0% |
1380 |
|
HBO |
43.4% |
42.5% |
10.3% |
2.4% |
1.2% |
0.2% |
100.0% |
1991 |
|
NHBW |
77.0% |
16.8% |
5.5% |
0.2% |
0.2% |
0.3% |
100.0% |
453 |
|
NHBO |
39.1% |
48.2% |
11.6% |
0.5% |
0.5% |
0.1% |
100.0% |
1468 |
